Exploring EV Demand in the UK
March 03, 2026 by Iain Reid

Electric vehicles are now very popular in the UK, but is the EV charging infrastructure keeping up with the rising EV registrations?
Electric vehicles are no longer a niche in the UK; they’re showing up in rural towns as well as major city centres. That shift is only expected to speed up as the 2030 petrol and diesel sales ban gets closer.
But while EV adoption keeps rising nationally, the real story sits at a local level. Some areas are charging ahead with electric ownership, while others are still early in the transition. More importantly, charging infrastructure isn’t always growing at the same pace as demand, which is where things start to matter for drivers thinking about switching.
Using adoption data, charging network coverage, government investment figures, and survey insights, Carwow’s recent study looks at where EV ownership is strongest in the UK and whether infrastructure is keeping up.
The State of EV Adoption in the UK
EV demand is climbing quickly, even if it hasn’t quite hit government targets yet. New electric vehicle registrations reached 473,348 in 2025, making up 23.4% of all new car sales. That means roughly one in four new cars sold last year was fully electric, which is a huge jump compared to just a few years ago. This makes the UK Europe’s second-largest EV market by volume.
That said, adoption still sits below the 28% ZEV mandate target for 2025, and targets only increase from here. By 2026, manufacturers are expected to ensure that around one in three new registrations is zero-emission. A wider choice of models, improved driving range, and the return of government backing through the Electric Car Grant have improved the outlook for BEV adoption in 2026, with battery electric vehicles now projected to account for 28.5% of the market. While this marks clear progress for 2025, it still falls short of the mandated 33% target for the year.
Hybrid and plug-in hybrid vehicles are also growing quickly, with electrified vehicles as a whole being close to becoming the majority of new registrations. But the UK’s full transition depends heavily on drivers feeling confident that owning an EV is practical for day-to-day use, and that’s where local infrastructure plays a big role.
The UK Areas Leading EV Adoption
Some UK areas are clearly moving faster than others when it comes to electric ownership. Looking at EVs as a percentage of all licensed vehicles helps show where electric cars are already becoming part of everyday driving.
Windsor and Maidenhead – Index score of 100
Windsor and Maidenhead records 80,563 EVs, representing 28.7% of licensed vehicles. Strong suburban adoption is likely driving these numbers, helped by higher access to home charging and newer housing developments. However, public charging availability is relatively low compared to EV numbers, which suggests infrastructure could struggle to keep pace if adoption continues rising at the same rate. EV share across the vehicle fleet has grown from 0.4% in Q1 2020, marking an increase of 28.3 percentage points over the past five years.
Stockport – Index score of 100
Stockport records 109,389 EVs, accounting for 25.2% of licensed vehicles in 2025 Q1. This shows strong EV confidence across commuter areas feeding into Greater Manchester. As more residents switch to daily travel into the city, reliable public charging and workplace infrastructure will likely become more important to support continued growth. EV share has climbed sharply from just 0.3% in Q1 2020, an increase of around 25 percentage points over the previous five years.
Peterborough – Index score of 99
Peterborough records 49,872 EVs, representing 19.9% of licensed vehicles. Additionally, EV share has risen from 0.9% in Q1 2020, increasing by around 19 percentage points over the five years. Adoption levels suggest strong uptake among residential drivers and commuters travelling to nearby cities. Continued expansion of public charging will be key, especially for households without access to off-street parking.
Milton Keynes – Index score of 99
Milton Keynes records 65,841 EVs, representing 16.4% of licensed vehicles. The town has built a reputation for early investment in EV infrastructure and smart mobility projects. Strong adoption suggests continued demand for rapid and destination charging to support both local drivers and commuters passing through the area. Looking at progress from Q1 2020, we can see a fast increase of 15.6 percentage points.
Swindon – Index score of 99
Swindon records 53,634 EVs, accounting for 16.2% of licensed vehicles. In 2020 Q1, EVs in Swindon only accounted for 0.7% of all registered vehicles, showing a growth of around 15.5 percentage points. Its location between London and Bristol supports commuter EV usage, and adoption is steadily growing. Expanding public charging will help support drivers who rely on shared infrastructure rather than home charging.
Slough – Index score of 98
Slough records 34,711 EVs, with electric vehicles accounting for 16.8% of licensed vehicles. As part of a major commuter corridor west of London, EV growth here reflects a mix of fleet usage and commuter adoption. Public charging remains comparatively limited, which could become a pressure point if EV uptake continues to increase quickly. When we look at progress from 2020 Q1, we can see EV share has grown rapidly over the years from only 1.4%, rising by around 15.4 percentage points.
South Gloucestershire – Index score of 98
South Gloucestershire records 42,610 EVs, with EVs representing 12.8% of licensed vehicles. Impressively, EV share in South Gloucestershire has grown from 0.3% in Q1 2020, increasing by around 12.5 percentage points. Suburban housing and greater driveway access likely support early EV uptake here. However, as adoption spreads across more built-up areas, maintaining accessible public charging will still be important.
Leeds – Index score of 97
Leeds records 51,392 EVs, with them making up 9.8% of licensed vehicles in Q1 of 2025. Adoption of EVs has increased from 0.7% in Q1 of 2020, meaning there has been a growth of around 9.1 percentage points. This shows that the city is transitioning more rapidly towards low-emission vehicles, supporting climate goals and improvements in air quality. There also appears to be a reasonable investment into charging infrastructure, supporting more growth in the future.
Manchester – Index score of 97
Manchester records 17,383 EVs, accounting for 8.1% of licensed vehicles in Q1 of 2025. Considering this percentage was at 0.2% in Q1 of 2020, there’s been an increase of around 7.9 percentage points. Widely known as ‘the capital of the North’, Manchester’s adoption of EVs shows strong progress likely both for commuters and private businesses with fleets. As there has also been a large increase in the infrastructure for charging, this trend will likely be supported going forwards.
Portsmouth – Index score of 96
Portsmouth records 11,794 EVs, which represents 7.9% of licensed vehicles. In 2020 Q1, EVs only accounted for 0.5% of all registered vehicles, showing a growth of around 7.4 percentage points. The city has shown a good increase in EV adoption, with a respectable growth in the charging infrastructure reflecting a similar pattern. This indicates progress towards transport sustainability goals and a commitment to become more eco-friendly.
Where EV adoption remains lower
While adoption is accelerating nationally, several rural and remote areas still show low EV ownership as a share of total vehicles, and slow growth over the years. For example, Blaenau Gwent had the lowest EV growth over the 5 years out of all regions, with a growth of 0.9 percentage points over the five years and has an index score of 2. In 2025 Q1, Blaenau Gwent also recorded an EV market share of only 1%, which is the lowest EV market share across the UK.
Birmingham records EVs accounting for 1.8% of all licensed vehicles in 2025 Q1, placing it among the lowest EV adoption areas in the UK. EV ownership here has increased by only 1 percentage point since Q1 2020, showing positive gradual progress, although overall growth remains modest compared to other urban areas.
Additionally, Powys records EVs representing only 1.2% of licensed vehicles in Q1 2025, reflecting relatively slow adoption levels. EV share has grown by 1 percentage point since Q1 2020, suggesting steady but cautious uptake.
However, lower adoption doesn’t always mean the cities are less prepared for EV demand. It is important to consider that in many of these areas, home EV charging is more common and driving patterns differ significantly from urban environments. But slower uptake can still reflect higher upfront costs, longer travel distances, and limited charging infrastructure coverage.
Is EV charging infrastructure keeping up?
One of the clearest ways to understand EV charging infrastructure pressure is by comparing charging devices to EV ownership levels.
In some high-adoption areas, EV growth is running ahead of charging availability. For instance, Windsor and Maidenhead record 157 chargers per 100,000 EVs as of October 2025, suggesting public charging could struggle to keep pace with local EV numbers. Additionally, Slough records 234 chargers per 100,000 EVs as of October 2025, also showing potential infrastructure strain.
Swindon records 264 chargers per 100,000 EVs as of October 2025, suggesting demand and pressure could increase quickly as EV numbers grow.
Meanwhile, some urban boroughs show significantly higher charging availability relative to EV ownership in comparison to rural towns. Hackney, for example, records an impressive 45,120 chargers per 100,000 EVs as of October ‘25.
Further highlighting this pattern, Tower Hamlets records an impressive 36,219 chargers per 100,000 EVs as of October 2025, and Coventry records 37,885 chargers per 100,000 EVs. Additionally, Waltham Forest records 28,187 chargers per 100,000 EVs. Hammersmith and Fulham also records 28,944 chargers per 100,000 EVs.
High charger ratios don’t always guarantee availability, but they generally indicate stronger local investment and reduced range anxiety for drivers relying on public electric vehicle charging infrastructure.
Which regions are investing the most in EV infrastructure?
Government funding through the Local Electric Vehicle Infrastructure (LEVI) programme highlights where councils are actively planning for EV growth.
Regional LEVI allocations include:
- South East, investing £11.97 million
- North West, investing £7.79 million
- South West, investing £7.67 million
- East of England, investing £6.87 million
- East Midlands, investing £6.76 million
- Yorkshire and The Humber, investing £6.23 million
- West Midlands, investing £6.04 million
- London, investing £4.23 million
- North East, investing £2.76 million
This funding is aimed at helping councils develop long-term charging strategies, particularly in residential areas without driveways and across commuter towns where public charging demand is expected to grow.
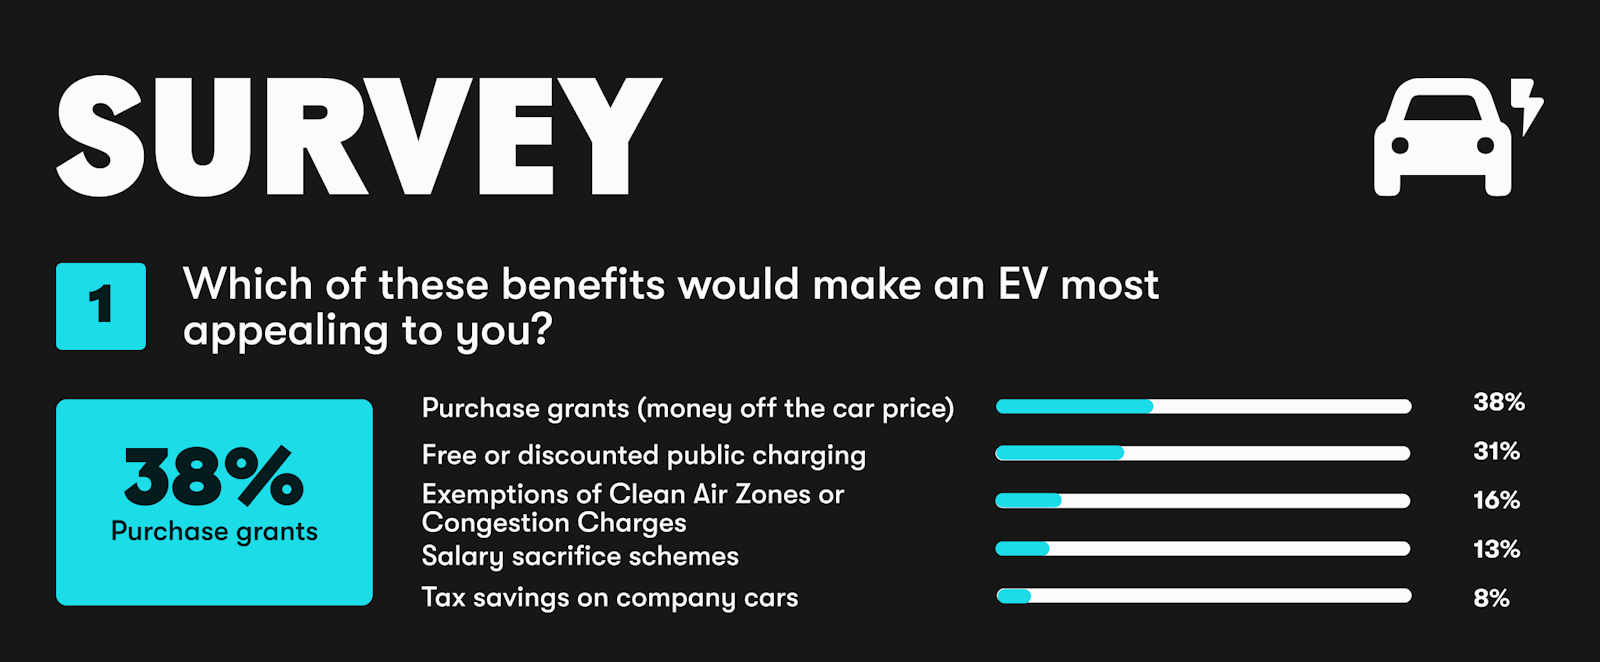
Do Incentives Still Influence EV Demand?
Carwow’s survey data of just under 4,000 active UK car buyers since the launch of the scheme suggests financial incentives still matter, but awareness is a major issue. For example, 64% say they didn’t know the grant existed.
However, recent data from the survey indicates that the grant has provided a big incentive for many people in the UK to invest in EVs. 73% of drivers admit a full £3,750 electric car grant would make them more likely to switch.
Despite this, cost still remains a major barrier for some, with 23% saying EVs remain too expensive. Attitudes towards EVs are also mixed, as 21% say they simply do not want one. However, environmental concerns continue to influence consumer decisions, with 65% saying environmental impact will affect the choice of their next car.

Carwow enquiry data shows EV interest steadily rising through 2025. September, traditionally a key month for new car purchases due to the new registration plate, saw consumer interest on Carwow peak. Leads for grant-eligible EVs reached 28.8% of all electric vehicle leads on Carwow, up from 23% in March 2025 before the grant was announced. However, that uplift didn’t last and by December, the share of leads for grant-eligible models had fallen to just 17%. While incentives create short-term boosts, overall confidence in charging access and affordability still appears to drive long-term adoption.
What This Means for Drivers Considering an EV
EV ownership experience still depends heavily on location in the UK. In high-adoption areas, charging networks can feel busier, particularly during commuting hours. However, in areas where EV growth is accelerating quickly, infrastructure may take time to catch up.
Drivers who rely on public charging should consider the following factors:
- Charger availability near home and work
- Access to rapid chargers on regular routes
- Parking restrictions around charging points
- Charging reliability and pricing
Doing thorough research into EVs that offer the best value for money and comparing different options is also important. Drivers can explore available affordable electric models and offers through Carwow’s EV deals page.
Our EV charging guide also offers useful advice and tips for charging at home and on the road.
Conclusion
The UK’s EV transition is moving quickly, but it isn’t moving evenly. Some cities are already seeing electric vehicles become a normal part of daily driving, while others are still building confidence and infrastructure. In several areas, EV ownership is growing faster than charging availability, which could influence driver experience in the next few years.
Public awareness of incentives is also low, suggesting that affordability and charging confidence still play the biggest role in purchase decisions. As the 2030 petrol and diesel phase-out approaches, the areas that are best prepared for the transition are likely to be those that balance adoption growth with practical, accessible charging infrastructure.
Methodology
This study analyses electric vehicle (EV) adoption across UK local authorities by comparing EV ownership with public charging infrastructure availability, government incentives and consumer sentiment.
EV adoption data was sourced from the Department for Transport and DVLA vehicle registration statistics, analysing electric vehicles as a proportion of all licensed vehicles in each area. Growth trends were measured by comparing Q1 2020 and Q1 2025 data to assess how EV adoption has developed over time.
Public charging infrastructure was assessed using official UK charging device statistics, analysing total publicly available chargers, rapid charging availability and charging provision relative to local EV ownership. Private home and workplace chargers were excluded due to inconsistent reporting.
Government policy and financial incentives were reviewed to understand how funding schemes, tax incentives and infrastructure programmes may influence EV uptake.
Consumer sentiment data was also analysed to explore awareness of EV incentives, willingness to switch to electric vehicles and perceived barriers such as cost, charging access and vehicle range.
All data reflects the most recent available reporting periods and provides a snapshot of EV adoption trends across the UK.
Compare cars using Carwow


